RentRedi Launches Rental “Portfolio Performance” Dashboard to Help Landlords Track Real-Time Rental Property Equity and Health
New property performance metrics dashboard gives rental owners financial X-ray vision into NOI, cash flow, cash-on-cash return, and equity
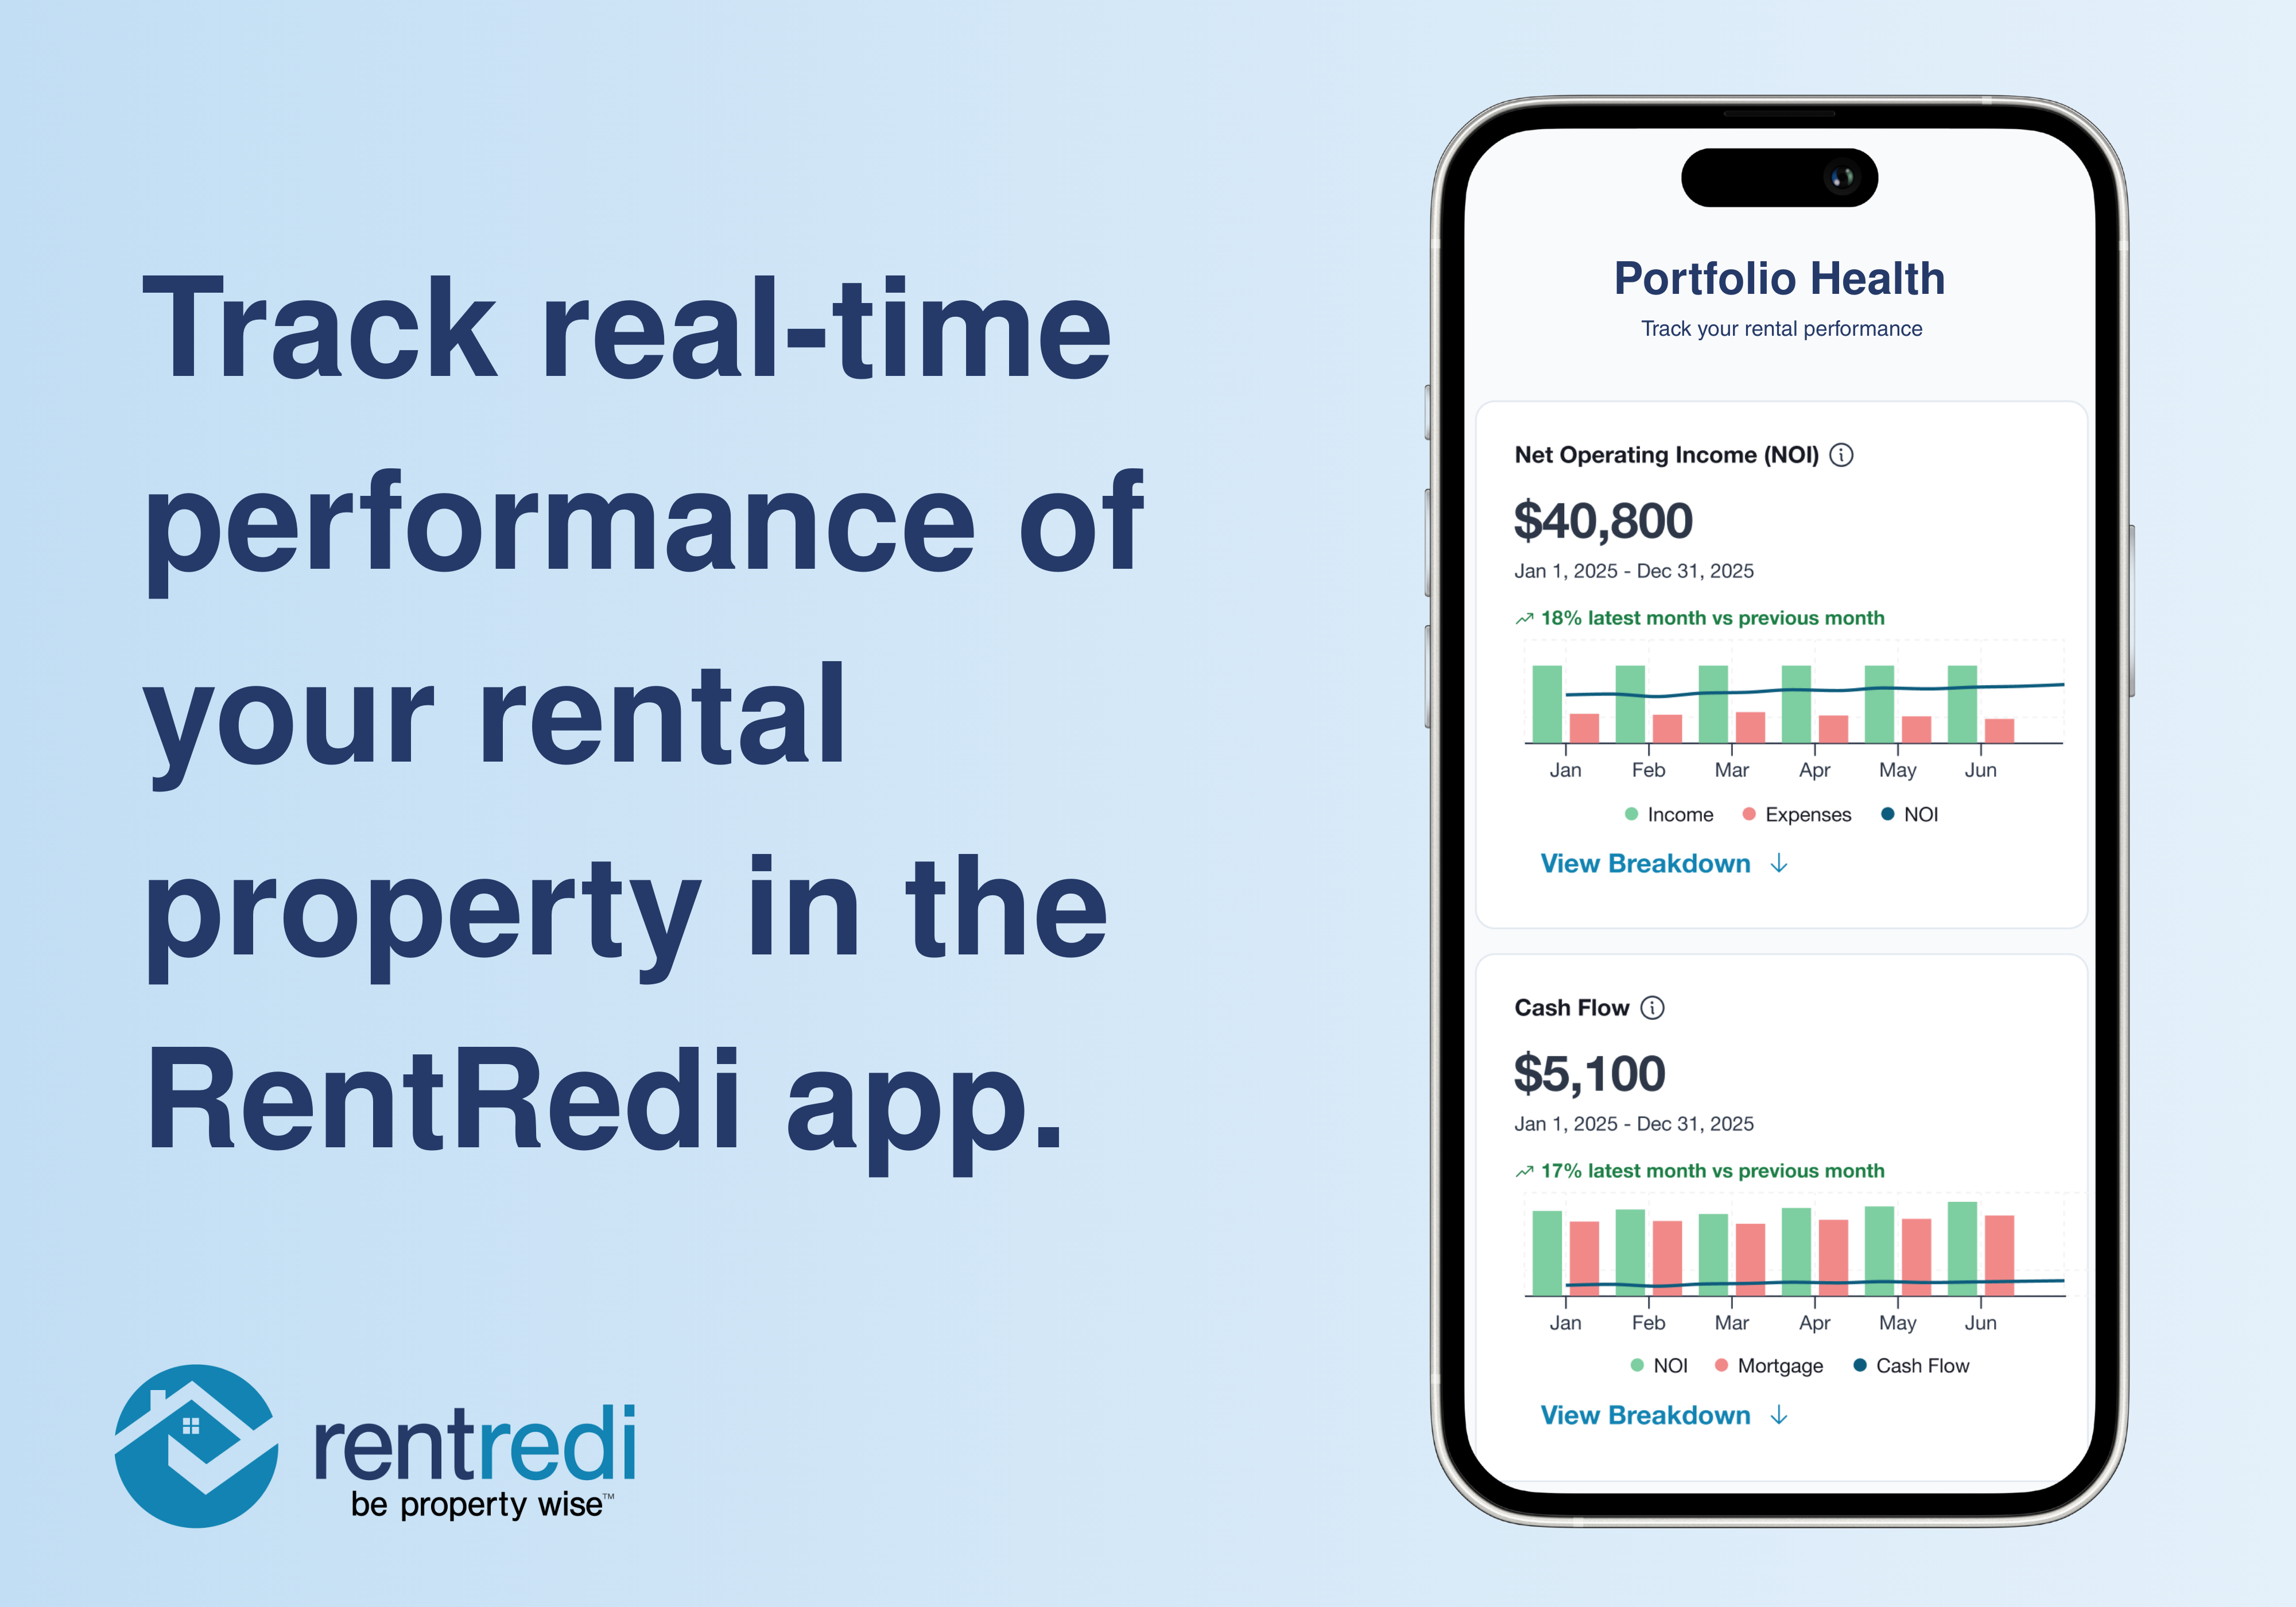
NEW YORK, March 11, 2026 (GLOBE NEWSWIRE) -- RentRedi, the fastest-growing property management software built for smart real estate investors, announced the launch of Portfolio Performance, a financial analytics suite designed to help landlords visualize, monitor, and grow their rental business in real time. Portfolio Performance analyzes data from rent collection, maintenance coordination, and accounting to provide a unified view of the financial health of a rental property in a single dashboard.
RentRedi’s Portfolio Performance dashboard is a data visualization tool that gives landlords a live snapshot of four metrics that matter most when building wealth through a rental property or portfolio:
- Net Operating Income (NOI)
- Cash Flow
- Cash-on-Cash Return
- Estimated Equity
Portfolio Performance helps landlords move beyond collecting rent and toward actively managing long-term return on investment (ROI).
Key Takeaways
- Portfolio Performance is a built-in financial analytics suite within RentRedi.
- Tracks NOI, Cash Flow, Cash-on-Cash Return, and Equity in real time.
- Pulls automatically from rent collection and expense tracking data.
- Includes mortgage amortization schedules and equity calculations.
- Designed based on feedback from thousands of 5-star landlord reviews.
From Rent Collection to Real-Time ROI Tracking
Independent landlords evaluate income, expenses, and long-term appreciation when planning wealth-building strategies. The RentRedi Portfolio Performance delivers a faster, clearer way to see those numbers working together: your true monthly return, your growing equity position, and how this year’s performance stacks up against last year.
RentRedi’s Portfolio Performance dashboard was built to provide clear, confident answers to questions about actual monthly returns, equity, and year-over-year property performance. It brings your financial picture into focus in one place, so you can evaluate your investment and make decisions backed by real-time data (rather than estimates or spreadsheets).
“Portfolio Performance marks the next chapter for independent landlords,” said RentRedi Founder and CEO Ryan Barone. “With real-time insight into cash flow, expenses, equity growth, and ROI across their portfolio, landlords finally see exactly how their investments are performing. That visibility helps them move faster, reinvest smarter, and drive stronger performance across every property they own.”
View this video to see how the RentRedi Portfolio Performance dashboard works: https://www.youtube.com/shorts/N0hxqHR2aP4
By connecting rent payments, expense tracking, and mortgage details, Portfolio Performance automatically calculates:
1. Net Operating Income (NOI)
NOI is gross rental income minus operating expenses (including taxes, insurance, repairs, and utilities), but before mortgage payments. NOI is one of the most important metrics in real estate because it reveals the core profitability of a rental property by showing whether the asset itself is performing independent of financing.
The NOI section of the RentRedi Portfolio Performance dashboard pulls operating expenses directly from accounting and expense tracking tools, ensuring calculations update dynamically as landlords log transactions. Repairs and maintenance costs entered through RentRedi’s maintenance management system also flow into the NOI section of the dashboard, giving landlords a real-time look at how property upkeep impacts performance.
2. Cash Flow
Cash flow is the money left after operating expenses and mortgage payments are paid. It shows what the property is actually producing each month in pre-tax income. While NOI measures asset performance on its own, cash flow reflects the real-world impact of both operations and financing, making it one of the clearest indicators of how an investment is performing today.
In RentRedi’s Portfolio Performance dashboard, cash flow is calculated automatically by combining your real-time NOI with the mortgage details you enter, including loan amount, interest rate, and term. The platform generates an amortization schedule that breaks out principal and interest, ensuring monthly payments are accurate. As rent is collected, expenses are logged, and loan balances decline, cash flow updates dynamically, giving landlords immediate visibility into how operational and financing decisions affect returns.
3. Cash-on-Cash Return
Cash-on-cash return measures how hard your invested cash is working. It compares annual pre-tax cash flow to the total cash you put into the deal (typically your down payment, closing costs, and upfront improvements) and shows that performance as a percentage.
RentRedi landlords can enter their total cash invested into the Portfolio Performance dashboard, and the system calculates cash-on-cash return using live cash flow data. Because cash flow adjusts as income, expenses, or mortgage balances change, the return percentage updates automatically. Instead of recalculating performance manually, landlords have a current, accurate measure of capital efficiency built directly into their dashboard.
4. Estimated Equity
Estimated Equity is the portion of the property you own outright: calculated as property value minus remaining loan balance. It reflects ownership growth over time through principal paydown and appreciation, making it a key indicator of long-term wealth accumulation.
RentRedi’s Portfolio Performance dashboard calculates estimated equity by combining mortgage balance data from the amortization schedule with the property value landlords provide, supported by fair market value data where available. As loan balances decrease or property values are updated, equity adjusts automatically, giving landlords a clear view of ownership growth and overall portfolio strength.
The Bigger Picture
These four metrics aren’t isolated numbers; they build on each other:
- Income and expenses drive NOI
- NOI and debt determine Cash Flow
- Cash Flow compared to invested capital defines Cash-on-Cash Return
- Loan paydown and appreciation grow Equity
Together, they shift the conversation from “Did rent come in?” to: “Is this property strengthening my financial position?”
That’s the purpose behind RentRedi’s Portfolio Performance dashboard: helping landlords manage assets like investors, not administrators.
Professional-Grade Analytics for the Independent Landlord
Large institutional investors have always relied on dashboards and financial modeling tools. Portfolio Performance brings that same clarity to independent landlords, without spreadsheets or manual calculations.
The top 3 benefits of the rental Portfolio Performance dashboard are enabling landlords to:
- Make smarter hold-or-sell decisions with clear performance data.
- Spot trends early by monitoring monthly return changes.
- Track wealth, not just rent, with equity and ROI visibility in one place.
“Portfolio Performance gives landlords real-time answers to critical performance questions: Are maintenance issues draining performance? Is one property dragging down the portfolio? Are there opportunities to grow faster?” added Barone. “Portfolio Performance moves landlords from thinking to knowing.”
Portfolio Performance is live for RentRedi subscribers. Rental owners and property managers can access it by navigating to any unit and selecting the “Performance” tab. Visit RentRedi for more information or to start tracking your rental property performance.
Frequently Asked Questions (FAQs)
What is RentRedi’s Portfolio Performance dashboard?
Portfolio Performance is a built-in financial analytics suite within RentRedi that helps landlords track rental property performance in real time. It visualizes key investment metrics like Net Operating Income (NOI), Cash Flow, Cash-on-Cash Return, and Estimated Equity in a single, easy-to-understand dashboard.
How does Portfolio Performance calculate NOI?
The dashboard calculates Net Operating Income (NOI) by subtracting operating expenses, such as taxes, insurance, repairs, and utilities, from gross rental income. Income data flows directly from rent collected in RentRedi, while expenses pull from accounting and maintenance records, ensuring real-time updates as transactions are logged.
How does RentRedi track cash flow?
Cash flow is calculated by subtracting mortgage payments from NOI. Landlords enter their loan details, including interest rate and term, and RentRedi automatically generates an amortization schedule. As rent, expenses, or loan balances change, cash flow updates dynamically within the dashboard.
What is cash-on-cash return in real estate?
Cash-on-cash return measures the annual pre-tax cash flow generated by a property compared to the total cash invested, typically including down payment, closing costs, and renovations. RentRedi calculates this percentage automatically using live property performance data, helping landlords evaluate capital efficiency.
How does Portfolio Performance estimate property equity?
Estimated Equity is calculated as property value minus remaining loan balance. RentRedi combines mortgage amortization data with the landlord’s estimated property value — supported by fair market value data where available — to show ownership growth over time.
Who is Portfolio Performance designed for?
Portfolio Performance is built for independent landlords and property managers who want professional-grade rental property analytics without manual spreadsheets. It’s designed to support hands-on owners focused on long-term financial growth and disciplined portfolio management.
Is Portfolio Performance included with RentRedi?
Yes. Portfolio Performance is available to RentRedi subscribers and can be accessed by navigating to any unit and selecting the “Performance” tab.
How does this help landlords grow their rental portfolio?
By centralizing rental property performance metrics in one place, Portfolio Performance helps landlords make informed hold, sell, refinance, or reinvest decisions. With clear visibility into ROI, cash flow trends, and equity growth, landlords can scale with greater confidence and clarity.
About RentRedi
RentRedi is the leading comprehensive, data-powered rental management software for smart landlords and investors. It helps landlords and their tenants rent smarter by providing all the tools and intelligence needed to optimize portfolios, boost retention, reduce turnover, and improve the lives of everyone in the rental process. By combining real-time data, user behavior insights, and customer feedback with a modern, intuitive interface, RentRedi delivers solutions that help savvy real estate investors increase revenue, reduce risk, save time, minimize friction, and improve relationships. For landlords, the all-in-one web and mobile app streamlines rent collection, listings, tenant screening, lease signing, maintenance coordination, accounting, and more. For their tenants, it includes online rent payment, auto-pay, credit building and boosting, 24/7 maintenance requests, among other services.
Founded in 2016, RentRedi is VC-backed and a proven PropTech leader, recognized by the Inc. 5000, Deloitte Technology Fast 500, Inc. Power Partners, Fast Company’s Next Big Things in Tech, and HousingWire’s Tech100. With more than $33 billion in assets under management and nearly 300,000 landlords and tenants using its platform, RentRedi partners with leading technology providers including Zillow, TransUnion, Experian, Equifax, Realtor.com, Lessen, Thumbtack, Plaid, and Stripe to create the best customer experience possible. Learn more at RentRedi.com.
A photo accompanying this announcement is available at https://www.globenewswire.com/NewsRoom/AttachmentNg/6ed31007-3587-4a31-9843-deddd303f704
A video accompanying this announcement is available at https://www.globenewswire.com/NewsRoom/AttachmentNg/dc1ac0eb-f10d-4856-8953-3f5c457a0fb1

RentRedi Media Contact:
Jennifer Tolkachev
jen@rentredi.com
![]()
Analytics view of RentRedi Portfolio Performance dashboard

RentRedi Portfolio Performance dashboard displaying rental property analytics, including net operating income (NOI), cash flow, cash-on-cash return, and estimated property equity, helping independent landlords monitor real estate investment performance in real time.
Legal Disclaimer:
EIN Presswire provides this news content "as is" without warranty of any kind. We do not accept any responsibility or liability for the accuracy, content, images, videos, licenses, completeness, legality, or reliability of the information contained in this article. If you have any complaints or copyright issues related to this article, kindly contact the author above.
